
The power factor triangle relates real power P, reactive power Q and apparent power S in an AC system. In an inductive load, current lags voltage; in a capacitive load, current leads voltage. Power factor describes how effectively apparent power is converted into useful real power, but its sign and notation depend on the measurement convention. Understanding the triangle prevents a common mistake: adding capacitors without checking the existing reactive-power direction.
For authoritative terminology and safety context, consult NIST unit guidance, OSHA electrical safety guidance và U.S. Department of Energy grid resources.
For equipment context, compare the power factor calculator guide, , motor power factor guide và power factor correction device guide.
Applying the power factor triangle
Use the triangle to keep units and signs consistent: horizontal P is real power in kW, vertical Q is reactive power in kvar and the hypotenuse S is apparent power in kVA. The magnitude relationship is S² = P² + Q² and the power factor magnitude is P/S. The sign of Q or the meter’s lead/lag indication supplies direction; the PF magnitude alone does not.
For a three-phase load, confirm whether the meter reports total values or per-phase values. Check CT ratio, phase sequence, polarity and harmonic distortion before using the result to size correction. Retain the measurement interval, operating load, capacitor stage and instrument convention in the calculation record.
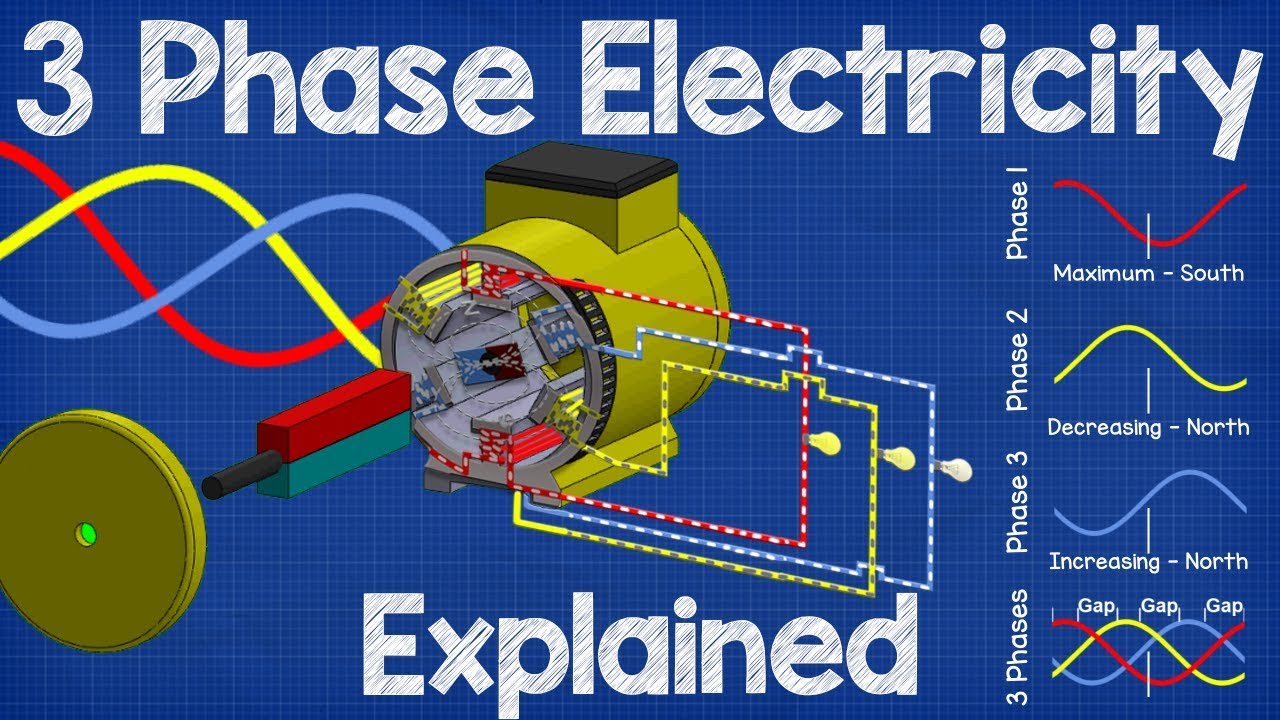
Video kỹ thuật trung lập
This neutral power-quality video supplements the triangle calculation; use calibrated measurements and the approved engineering method for final decisions.
Real, reactive and apparent power
Real power, measured in watts, performs useful work or produces heat. Reactive power, measured in var, moves energy between the electric and magnetic or electric fields of components. Apparent power, measured in VA, is the product of RMS voltage and RMS current in a single-phase circuit, or the corresponding three-phase relationship. For a sinusoidal load, the power triangle relates them as S² = P² + Q², and displacement power factor is P/S. The angle between voltage and current determines whether Q is conventionally positive or negative.
Real installations may also have waveform distortion from drives, rectifiers, LED supplies and converters. A true-power meter can report total power factor that includes distortion, while a simple phase-angle description captures only displacement. Ask the meter or power-quality report which definition it uses. Do not compare a displacement reading from one instrument with a total-power-factor reading from another as though they were identical.
| Condition | Current relationship | Typical consequence |
|---|---|---|
| Inductive load | Current lags voltage | Positive reactive demand under a common utility convention; motors and transformers are typical examples |
| Capacitive load | Current leads voltage | Negative reactive demand under the same convention; capacitors and long lightly loaded cables can contribute |
| Near-unity displacement | Small phase angle | Lower reactive current for the same real power, if distortion is also controlled |
| Distorted current | Not represented by one phase angle alone | Harmonic current can raise RMS current and losses even when displacement PF looks good |
What “leading” and “lagging” mean on a waveform
Imagine voltage as a reference sine wave. If the current waveform reaches its corresponding peak later, current lags. If it reaches the corresponding peak earlier, current leads. The direction is a phase relationship, not a statement about which quantity is numerically larger. A lagging power factor such as 0.85 lagging is not the same thing as “85% current.” It indicates a phase angle and, depending on the meter, may or may not include distortion.
Check the sign convention before acting. Some instruments display lagging/leading text; others show positive or negative kvar, a quadrant, or a signed angle. CT polarity, phase sequence and voltage-reference wiring can reverse the displayed result. A sudden leading indication after maintenance may be a wiring or configuration issue rather than a real change in the load.
Why inductive loads usually lag
Motor windings and transformer magnetizing branches store energy in magnetic fields. Their current has a reactive component that lags the applied voltage under the usual reference convention. At light load, a motor’s magnetizing component can represent a larger share of its input current, so power factor often worsens. Variable-speed drives change the input-current waveform and may require a separate assessment of displacement and distortion.
Correction is not automatically “add more capacitance.” Capacitor banks can interact with system impedance, amplify harmonics, create transient overvoltage or overcorrect during lightly loaded periods. A correction controller should switch stages based on measured conditions and be coordinated with drives, generators, transformers and utility rules. The Fluke power-factor overview provides measurement context; the project engineer must still select equipment and settings for the actual network.
Why capacitive loads can lead
A capacitor stores energy in an electric field, producing a current that leads voltage in the idealized sinusoidal model. Power-factor-correction capacitors are intentionally used to offset inductive reactive demand. Long unloaded cables, filters and some converter front ends can also contribute leading reactive current. If the inductive load is disconnected while the capacitors remain connected, the system may become leading.
Leading operation can be undesirable for a utility connection or generator. It may affect voltage regulation, generator excitation, transformer loading and protection behavior. Define the allowed operating range with the utility or system study. A single instantaneous meter reading is not enough to decide whether a bank should be resized; capture load, kvar, harmonics, switching state and time of day.
Measure before correcting
Use a true-power-quality analyzer or a meter suited to the voltage, current and category of the installation. Confirm CT ratio, voltage leads, phase order, frequency, sampling method and whether the instrument reports total or displacement power factor. Record kW, kvar, kVA, RMS current, voltage, THD, individual harmonics and the state of capacitor or filter stages. Compare measurements at minimum, normal and peak loading. A clamp meter that shows current and voltage separately cannot by itself determine leading or lagging phase.
Validate the instrument connection against the approved measurement procedure and local safety requirements. In a three-phase system, one reversed CT or voltage lead can create a plausible but incorrect quadrant. Compare total real power with the expected load and check that the three phase values add sensibly. If the readings contradict the single-line or billing meter, stop and resolve wiring or configuration before changing correction equipment.
Calculate the correction target carefully
For a sinusoidal inductive load, a first estimate of capacitor reactive power is Qc = P(tan φ1 − tan φ2), where P is real power, φ1 is the measured initial angle and φ2 is the desired angle. Use consistent units and do not treat this as a final design. The formula does not capture harmonic resonance, rapidly changing loads, generator limits, step size, switching transients or the capacitor’s voltage rating. The final bank requires a system study and manufacturer application guidance.
For example, if a measured load is 100 kW with a lagging power factor of 0.80 and the target is 0.95, the formula gives an approximate reactive requirement for a steady sinusoidal case. The result is only a starting estimate: actual kvar, capacitor tolerance, voltage, harmonics and load variation may change the selected stages. A controller that holds a target at one load point can overcorrect at another. Keep the example separate from a quotation or installation instruction.
Power-factor correction in a switchboard
Correction can be installed centrally at a main board, at a feeder, or close to a large inductive load. Central correction is easier to manage but reactive current may still flow in downstream conductors. Local correction can reduce feeder current but must be coordinated with motor switching and discharge timing. Detuned reactors, active filters or hybrid systems may be needed where harmonics make plain capacitors unsuitable.
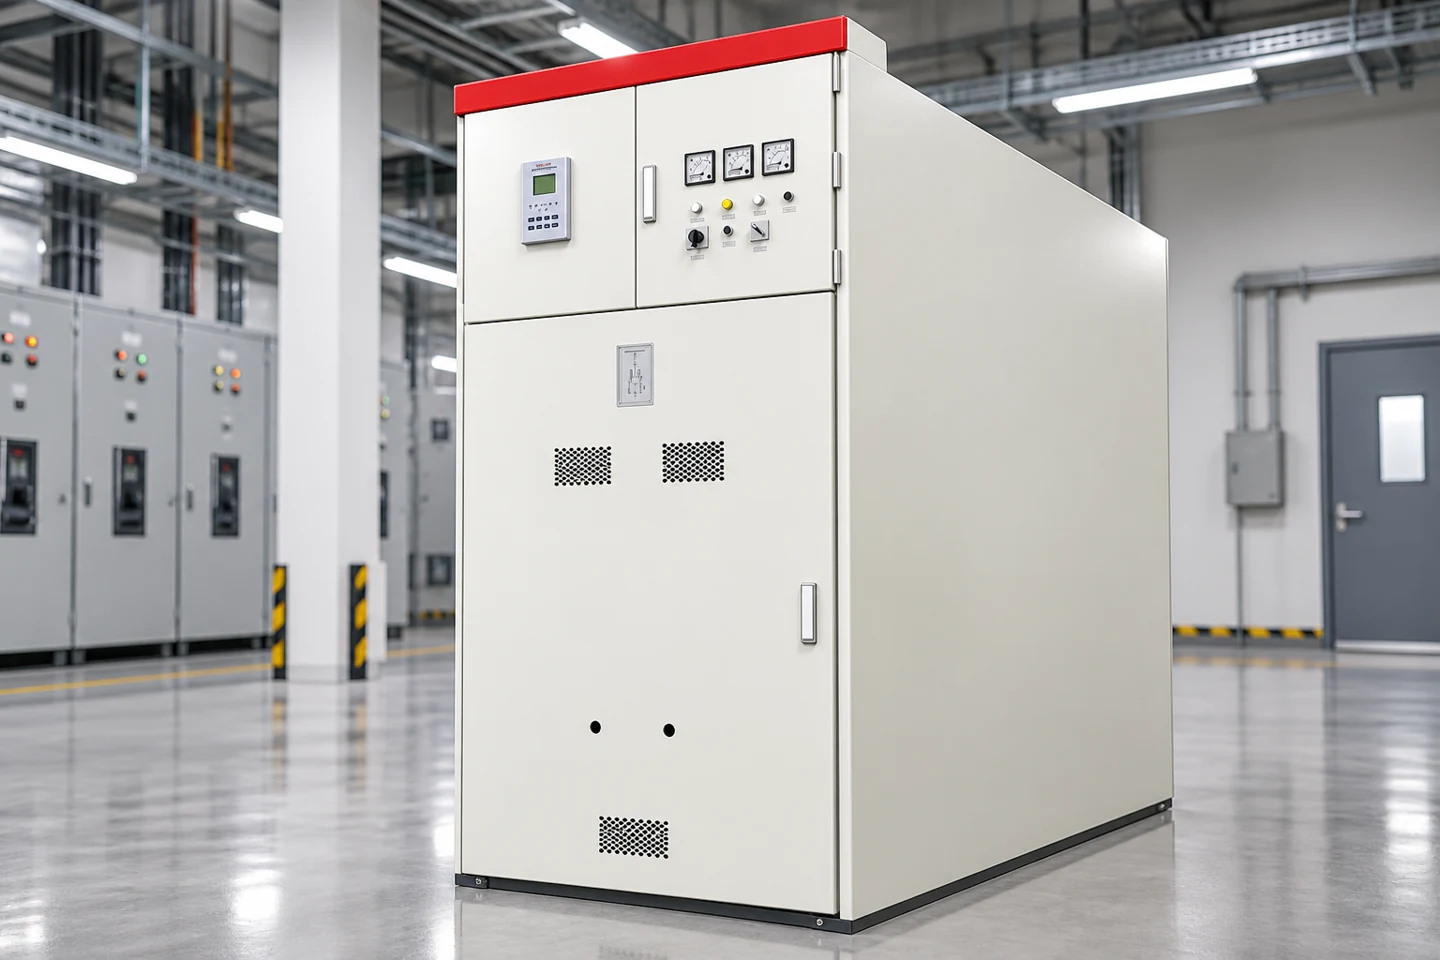
The LBAJI GGD low-voltage switchgear can be part of a low-voltage distribution arrangement in which metering and correction are engineered. A product enclosure does not prescribe the bank size or acceptable power factor. For withdrawable distribution sections, the LBAJI MNS/GCK/GCS product page is a reference for cabinet architecture, not a substitute for the customer’s harmonic and load study.
Common errors when interpreting a leading reading
First, check whether the meter uses the same convention as the utility bill. Second, check CT polarity and voltage-reference order. Third, inspect switched capacitor stages, filters and lightly loaded cable sections. Fourth, check whether a drive or converter changed the current waveform. Fifth, compare several time periods. Only after these checks should you decide whether the installation needs correction, a controller change, harmonic mitigation or a measurement repair.
Maintain records of baseline readings, bank stage status, contactor operations, fuse condition, discharge resistors, reactor temperature and alarm history. Inspect for swollen capacitors, abnormal noise, heat, loose connections and nuisance switching. Work on energized correction equipment requires qualified personnel and an approved isolation procedure; residual charge can remain after disconnection.
Further viewing: The University of Colorado’s power-factor education material is useful background for the phase relationship; it does not replace a site power-quality study.